The most encouraging item in todays jobs report was the sharp drop in underemployment (which includes not only those who are unemployed but also marginally attached workers and those who are part time for economic reasons). The underemployment rate fell to 16.5%, down from its peak of 17.4% last October and from 17.3% in December:
The headline unemployment rate also declined; it now stands at 9.7%, down from its 10.1% peak in October and from 10.0% in December.
These declines are encouraging, but the labor market obviously has a long way to go. Just how far was reinforced by BLS’s updated figures on the number of payroll jobs. Total job losses now stand at 8.4 million since the recession began at the end of 2007.
The economy grew briskly last quarter. According to the advance estimate by the Bureau of Economic Analysis, gross domestic product increased at a 5.7% pace in the fourth quarter of 2009, faster than many forecasters had expected. (Note: BEA will revise this figure next month and the month after that. Oh, and then BEA will revise it periodically over the next few years.)
As usual, I think the best way to understand this report is to see what sectors contributed the most or least to reported growth:
As expected, much of the growth reflects businesses restocking their shelves and warehouses: inventories accounted for 3.4 percentage points of the overall 5.7% of growth.
Consumer spending grew at a moderate 2.0% pace and thus added 1.4 percentage points to overall growth (consumer spending accounts for about 70% of the economy and 70% x 2.0% = 1.4 %). That’s down from the previous quarter, when cash-for-clunkers boosted car purchases. Housing investment also slowed, again in the wake of earlier efforts–the tax credit for new home buyers–that had boosted growth in the third quarter.
Business investment in equipment and software showed signs of life, growing at a 13% pace, the strongest since early 2006. That added 0.8 percentage points to growth, slightly more than half of which was offset by the ongoing decline in business investment in structures.
Government spending fell slightly during the quarter. Stimulus efforts boosted non-defense spending by the federal government, but that increase was more than offset by a decline in defense spending and a small decline in state and local spending.
Amongst its usual cracker jack budget projections yesterday, the Congressional Budget Office provided a few toy surprises for budget watchers. One is an updated estimate of the direct budget costs of the 2009 stimulus bill, officially known as the American Recovery and Reinvestment Act (ARRA).
CBO originally estimated that ARRA would cost $787 billion from 2009 through 2019. Its new estimate is $862 billion, about $75 billion higher.
Key changes to the estimate:
Food stamps (officially known as the Supplemental Nutrition Assistance Program): $34 billion more than expected
Build America Bond program: $26 billion more
Unemployment compensation: $21 billion more
Medicaid: $3 billion less than expected
Other spending: $3 billion less
(CBO did not make any updates for the tax provisions in ARRA.)
For an earlier discussion of the stimulus being bigger than expected, see this post.
For a discussion of why the $862 billion figure (formerly known as the $787 billion figure) is not really the right measure of stimulus, see this post.
Note: CBO provides many details about ARRA in Appendix A of yesterday’s report.
(This is a slightly edited version of a piece that appeared yesterday over at e21.)
As policymakers ponder whether and how they might be able to do more to encourage job creation, they should keep in mind that the monthly payroll job figures [e.g., -85,000 in December] are the net result of literally millions of hiring and firing decisions each month. In addition to the well-known payroll data, the Bureau of Labor Statistics also provides information about the monthly pace of hiring, firing, etc. Those data, known as the Job Openings and Labor Turnover Survey or JOLTS, allow us to track the overall dynamism of U.S. labor markets and the relative balance of gross job gains and losses.
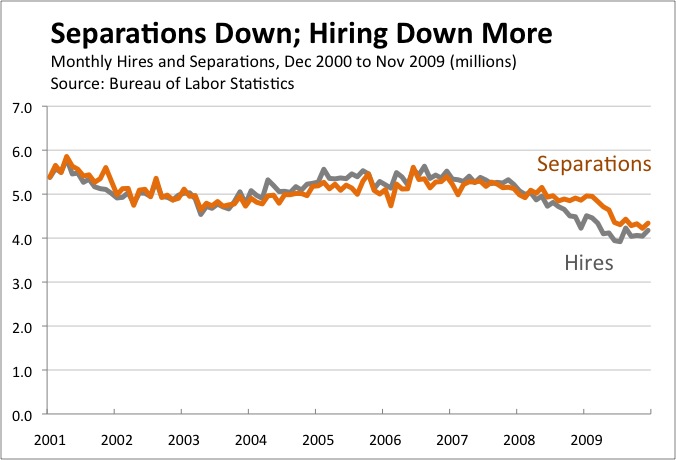
As shown in the following chart, the total number of new hires each month tracks fairly closely over time with the number of people who separate (either voluntarily or involuntarily) from their jobs:
As you would expect, new hires were higher than separations in the middle of the decade when employment was growing. Since the start of the recession, however, separations have outstripped hires by a wide margin.
As the chart shows, overall labor market activity has plummeted over the past two years. New hiring has fallen by more than 1 million workers per month. Employers hired more than 5 million new workers each month back in 2007, but have recently been hiring only slightly more than 4 million. Separations show a similar pattern, as about 1 million fewer workers are leaving their jobs each month than did before the recession.
The decline in separations may seem surprising at first, but is easily understood when separations are divided into layoffs and discharges (i.e., involuntary separations) and quits (i.e., voluntary separations):
As you would expect, layoffs and discharges increased sharply during the recession. During the depths of the financial crisis in late 2008 and early 2009, an average of more than 2.5 million workers lost their jobs each month. The pace of layoffs has since slowed—about 2.1 million workers lost their jobs in November—but remains above levels consistent with growing employment.
Quits, meanwhile, have fallen off a cliff. An average of 1.8 million workers left their jobs voluntarily each month during 2009, about 40 percent lower than the 3.0 million pace a few years ago. In short, many fewer workers are finding opportunities to move to better jobs.
The JOLTS data suggest that the pace of quits may be one of the best signs of a healthy labor market. The uptick in November—to the highest level in ten months—is thus welcome and something to keep an eye on in coming months.
The Federal Reserve system is doing its part to cut the budget deficit (at least for now). Treasury will receive $46.1 billion of profits from the Federal Reserve profits for fiscal 2009. That’s about a third higher than the amount remitted for 2008.
$46.1 billion in earnings on securities acquired through open market operations (U.S. Treasury securities, government-sponsored enterprise (GSE) debt securities, and federal agency and GSE mortgage-backed securities) [Profits on traditional open market operations plus the new credit easing operations]
$5.5 billion in net earnings from consolidated limited liability companies (LLCs), which were created in response to the financial crisis [Profits on the Maiden Lane partnerships etc.]
$2.9 billion in earnings on loans extended to depository institutions, primary dealers, and others [Profits on the new loan facilities]
[$2.6 billion in] net earnings from currency swap arrangements, which have been established with 14 central banks, and investments denominated in foreign currencies
Additional net earnings of $1.5 billion were derived primarily from fees of $0.7 billion for the provision of priced services to depository institutions
Those $58.6 in gross earnings were slightly offset by the following expenses:
[$3.4 billion for] operating expenses of the twelve Reserve Banks, net of amounts reimbursed by the U.S. Treasury and other entities for services the Reserve Banks provided as fiscal agents
[$2.2 billion in] interest paid to depository institutions on reserve balances [As noted previously, the Fed’s still-new ability to pay interest on reserves is a big deal for monetary policy; this is the cost side]
[$0.9 billion in] Board expenditures, including the cost of new currency
The resulting $52.1 billion in new profits were then distributed as follows: $46.1 billion to the Treasury, $1.4 billion as dividends to member banks, and $4.6 billion retained to “equate surplus with paid-in capital.”
The positives are fewer, so let’s start with them:
With job losses of 85,000, December was the second-best (or, if you prefer, second-least-bad) month since January 2008.
With today’s revisions, November actually showed job gains of 4,000, the first increase since December 2007.
Put that all together, and job losses averaged 69,000 per month in the last quarter of 2009. That’s unwelcome, but much better than the average of 691,000 jobs lost in each of the first three months of the year.
Employment in temporary help services–often viewed as a leading economic indicator–increased by 46,500 in December.
And here are the negatives:
December’s job losses were much larger than most forecasters had predicted.
The upward revision to November job growth happened only because October jobs were revised down, making November look better. The actual level of November jobs was also revised down (by 1,000).
Although the unemployment rate was steady at 10.0%, the details beneath that figure were horrible. Household-reported employment fell by 589,000; the only reason that the unemployment rate stayed constant is that even more people–661,000–dropped out of the labor force.
The labor force participation rate thus fell to 64.6% and the employment-to-population ratio fell to 58.2%, the lowest since 1985 and 1983, respectively.
The underemployment rate (U-6) increased to 17.3%.
Bottom line: The economy is growing (as suggested by other data), but that growth is not yet translating into new jobs.
Every January America’s economists gather for their annual conference. There are far more papers than one could ever read (or want to read), so you need a strategy to choose the most important.
In recent years, your optimal strategy should have included the papers by Carmen Reinhart and Ken Rogoff (see, e.g., this prescient paper from 2008). And so it is again in 2010.
This year’s installment is a paper that examines how government debt levels relate to economic growth and inflation. Their key finding? High levels of government debt have a substantial economic cost. In developed economies, that cost is weak economic growth. In emerging economies, that cost is weak economic growth and high inflation.
The growth findings are nicely illustrated in the following table from their paper:
Developed economies that have high levels of government debt (90% of GDP or more) have much lower rates of economic growth; for example, their median rate of growth has been a mere 1.6%, much less than the 3 to 4% growth of countries with lower debt levels. The same pattern holds for emerging economies, as well. (The third panel shows that high levels of public and private external debt also reduce growth, but the sample there includes only emerging economies.)
As R&R note, these results are particularly important today given the rapid growth in government debts around the world. In the United States, for example, debt will probably end the year around 60% of GDP, with no sign of stopping. The good news is that we are still relatively far from the 90% level that R&R identify as problematic. The bad news is that current policies will get us close to that level in less than a decade. For example, the Peterson-Pew Commission on Budget Reform recently projected that current policies would lift the debt-to-GDP ratio to 85% by 2018.
Happy 2010, everyone. To kick off the new year, I am in Atlanta at the annual meeting of the American Economic Association. As Paul Kedrosky notes, there are lots of sessions on the financial crisis and its aftermath. Perhaps not surprisingly, many presentations have a pessimistic tone. But there are pockets of optimism, including Robert Shiller’s luncheon speech about the potential benefits of continued financial innovation.
One of Shiller’s ideas is that the federal government should issue a new kind of security that would pay quarterly dividends based on the nation’s gross domestic product (GDP). More specifically, each security would entitle its owner to one-trillionth of America’s gross domestic product (GDP). These “Trills” would be perpetual, like common stock in a private company, and would be backed by the government’s full faith and credit.
I will leave to others to argue the pros and cons of Trills. What caught my attention was Shiller’s estimate of how much they would be worth. With GDP around $14 trillion, each Trill would pay about $14 in annual dividends this year. That dividend would then increase (or, of course, decrease) as the economy grows (or contracts) in the future.
How much you would be willing to pay for a Trill? In principle, that should depend on your expectations of future GDP growth and your choice of what discount rate to apply to cash flows that track GDP. Oh, and if you worry about the U.S. government defaulting (still a very low risk), you might include a discount for that as well.
Shiller’s own answer is $1,400. In other words, he thinks Trills would be priced with a yield of about 1%. Trill owners would be willing to accept that low yield because they would expect future economic growth to boost dividends–and, therefore, Trill values–in the future.
That figure feels a bit high to me, but not unreasonable. For example, you could justify a $1,400 per Trill valuation if you believe that nominal GDP growth will be 4 percent and that an appropriate discount rate would be 5 percent.
If you take Shiller’s estimate seriously, it is just a short step to placing a value on the U.S. economy as a whole. If one trillionth of the economy is worth $1,400, then the entire economy would be worth $1.4 quadrillion.
Within current budget rules, the Congress can indeed use unspent TARP money to “pay for” new spending initiatives. However, it needs to cut TARP authority by $2 for every $1 it wants to spend.
Those “savings” are mythical, however. Treasury Secretary Geithner recently predicted that TARP would use at most $550 billion of its $699 billion in authority. Trimming TARP’s authority by a moderate amount (e.g., $50 billion) will thus generate no actual budget savings. Only deep cuts would begin to generate some savings.
The financial system is not fully healed, and the United States still lacks a coherent system for dealing with large, failing financial institutions. For that reason, I support Geithner’s extension of TARP as an insurance policy. However, I do not support the TARP extension if its main effect it to allow Congress to use TARP “cuts” to generate mythical budget “savings” or to encourage creative uses of TARP money.
Usain Bolt had a remarkable year, but Chairman Bernanke is still the right choice as Person of the Year. And he’s the right choice for Fed Chairman.
But his work is only half done. If he can figure out an exit strategy that keeps the economy growing, avoids new asset bubbles, and sidesteps inflation, then maybe he will be Person of the Year again next year.